Kubernetes,
Native to JetBrains.
Manage clusters without leaving your code.
Are you looking for the cross-platform dashboard?
Visualkube Master (Invite-Only Beta)
The comprehensive, all-in-one cross-platform dashboard. Supports Web, Browser Extension, IDE, Mobile, and Desktop.
Why Visualkube Jet?
We stripped away the web views and heavy frameworks.
This is Kubernetes management reimagined for the JVM.
Native Performance
Built with Kotlin. Zero web views, minimal memory footprint, and instant startup times. Optimized specifically for the IntelliJ Platform.
Native Look & Feel
Uses standard JetBrains UI components. Whether you use Darkula or the New UI, it blends in perfectly without jarring context switches.
Developer Focus
View logs, edit YAMLs, and restart pods directly alongside your code. Includes mobile integration via account sync.
Key Features
True Cloud-Native IDE
Reactive event-driven Smooth updates for resources.
Real-Time Watching
Live monitoring of key Kubernetes (K8s) resources.
Multi-Cluster
Simultaneous connections with unified single-view management.
Automatic Reconnection
Seamless access to last connected single or multi-clusters.
Operations
Cluster Manager integrated with ~/.kube/config and reactive Pod list.
Runtime
Real-time log streaming via context menu and automatic popup.
Architecture
High-performance design using JetBrains Native UI.
Exploration
Cluster tree view with real-time namespace filtering via toggle UI.
Details
YAML editor with syntax highlighting and auto-scroll.
Supported IDEs (v2023.x+)
!Not available for VS Code. For VS Code support, use Visualkube Master.
Simple, Transparent Pricing
Enjoy v0.x.x Early Access for Free. From 1.0.0, Visualkube Jet becomes Freemium.
Freemium
- From 1.0.0, Freemium.
How to Install
Open IDE Settings
Open your JetBrains IDE and go to Settings.
Search Marketplace
Navigate to Plugins > Marketplace and type "Visualkube Jet".
Install & Restart
Click Install. Restart your IDE to activate the native components.
Getting Started
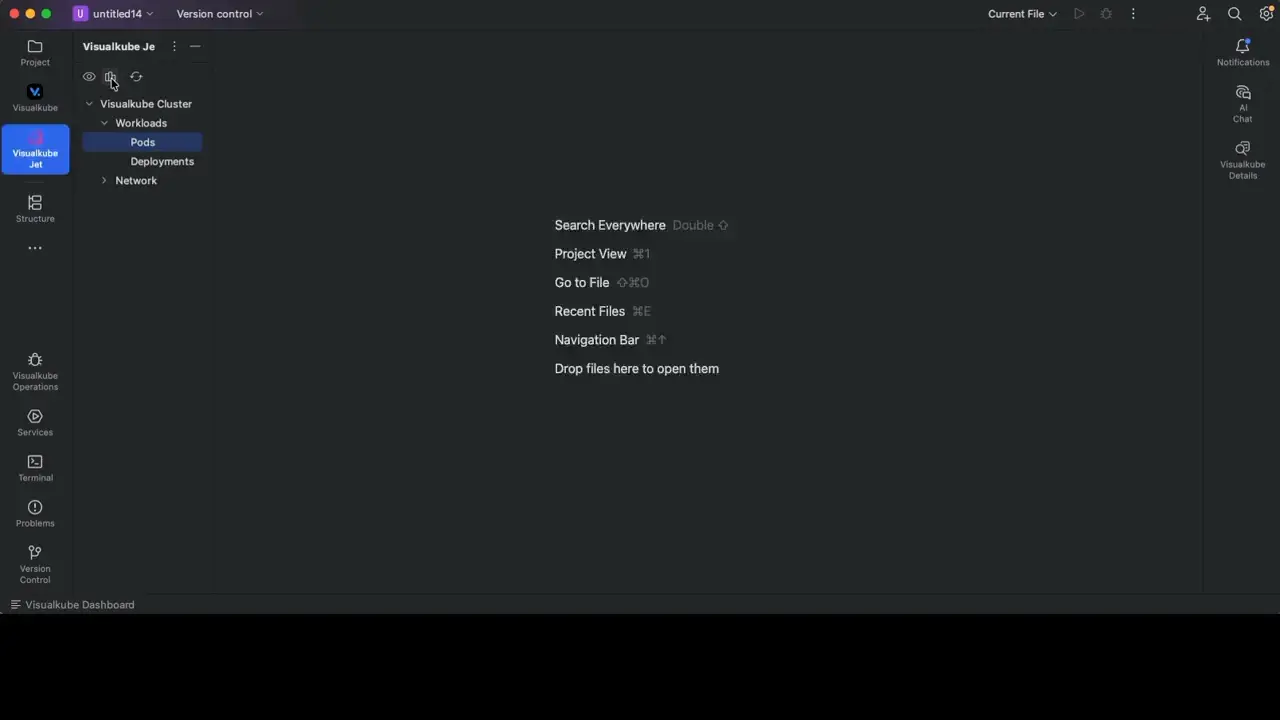
Step 1: Launch Visualkube Jet
Click the Visualkube Jet icon in the top-left corner of your IDE.
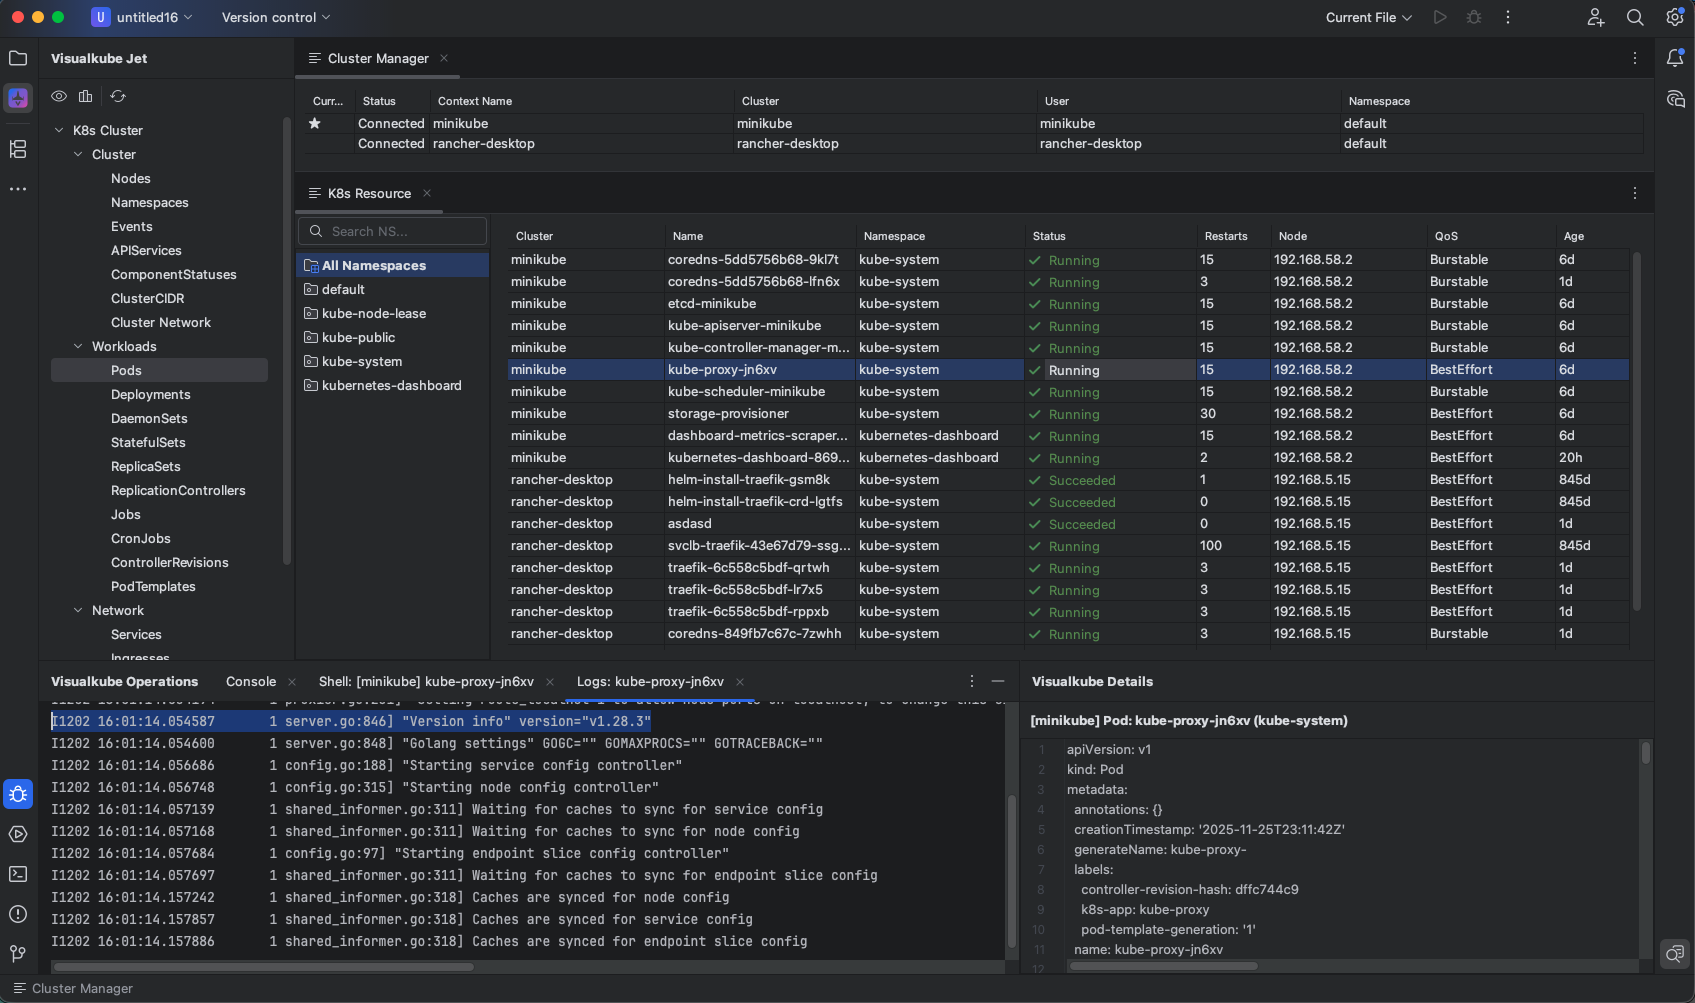
Step 2: Open Cluster Manager
Access the cluster list from the Visualkube Jet Tool Window. Current cluster is marked with a star.
Step 3: Explore Pods
Expand Workloads in the resource tree and click Pods to view running containers.
Step 4: Filter by Namespace
Use the Toggle Namespace icon to filter Pods by namespace.
Step 5: View YAML
Click the Visualkube Details icon to open the YAML viewer for selected Pods.
Step 6: Stream Logs
Right-click a Pod and choose Show Log to view real-time logs in the Operations window.